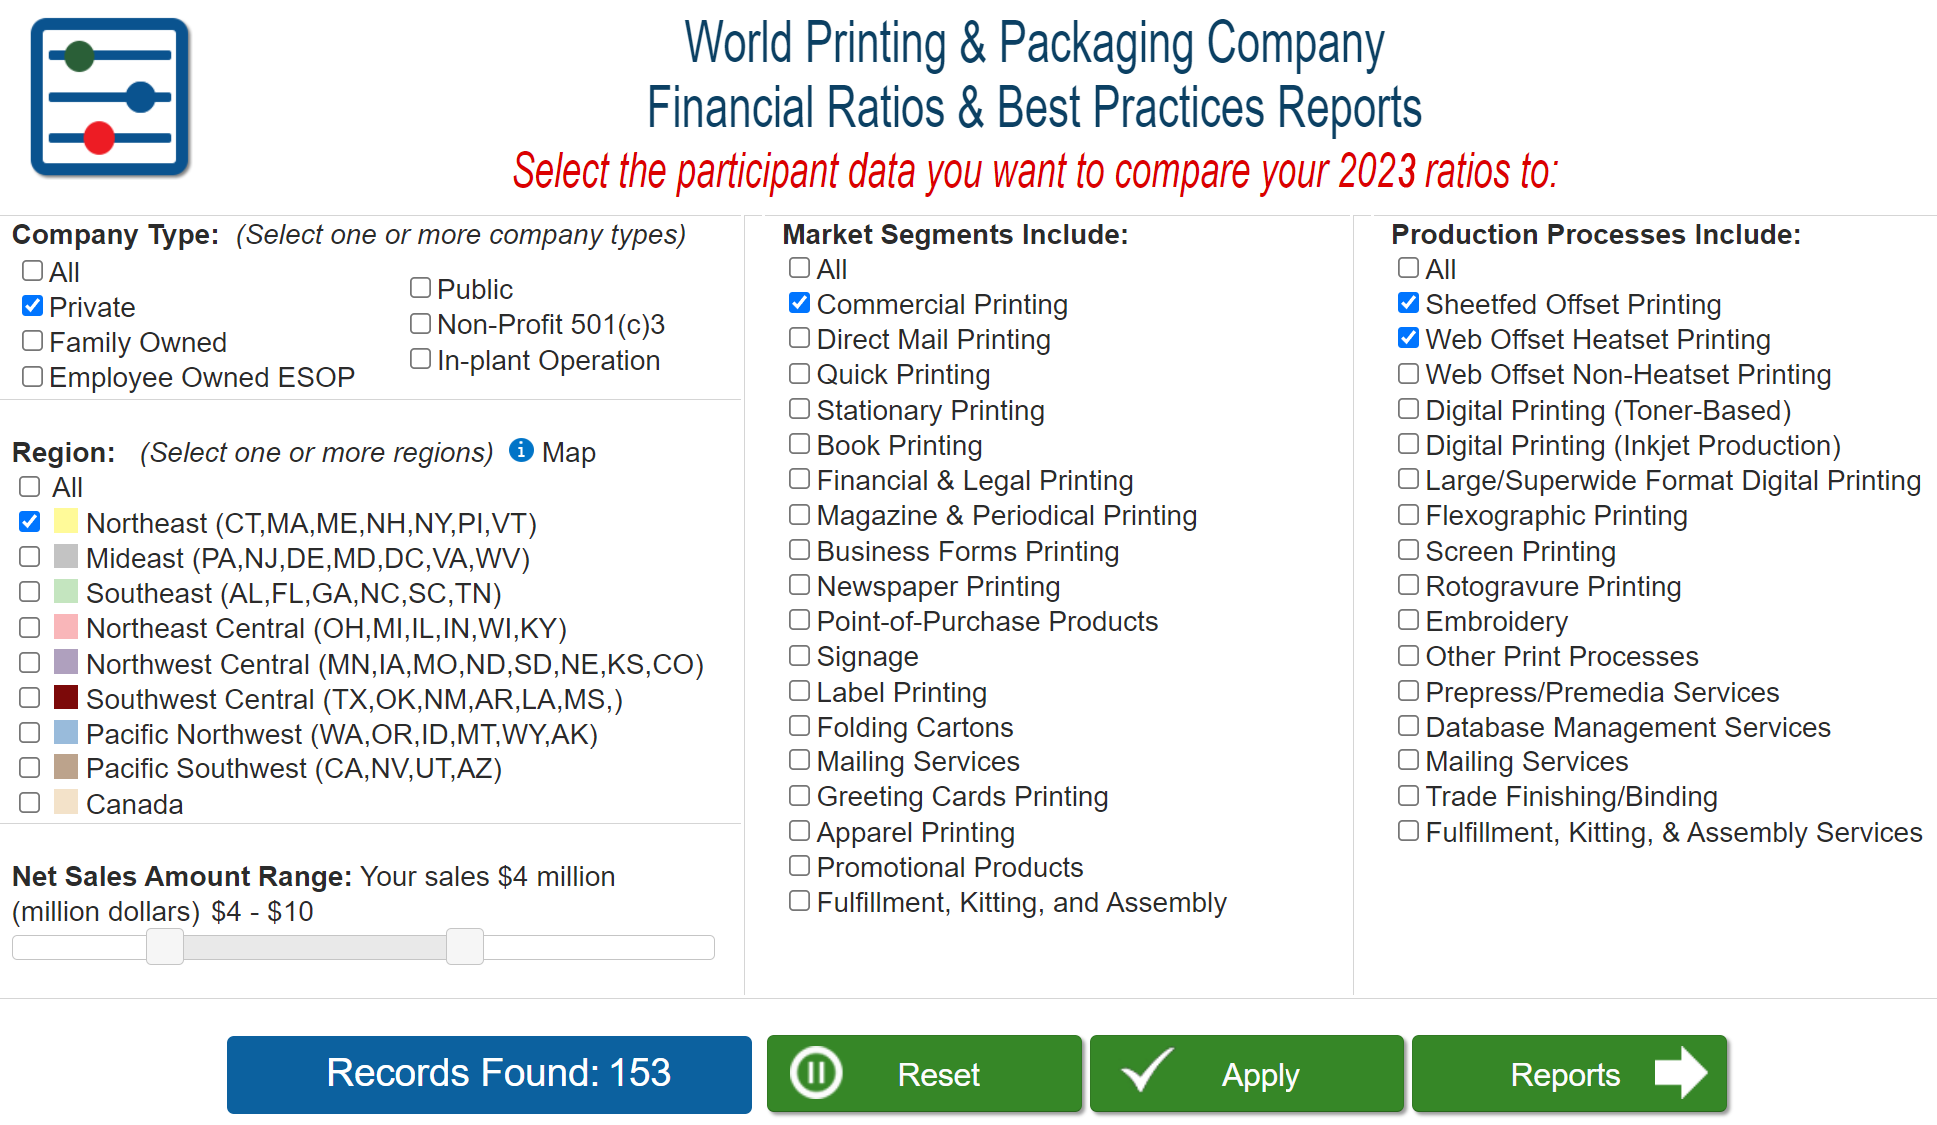
Financial Ratios Advisor logo Features How-It-Works Prices Contact Us
best value
All 2022-2023
Financial Ratios Reports Only
All 2022-2023
Financial Ratios Reports
Plus
Performance Analysis Reports Of Your Company's Financial Ratios & Health
$175
$595

Features Comparisons

Buy now Buy Now
Product summary
The complete set of 2022-2023 printing and packaging industry financial ratios reports with the ability to report ratios by sales volume range, geographic area, products produced, production equipment, and other criteria.
The complete set of 2022-2023 printing and packaging industry financial ratios reports. Plus an online analysis of your company's financial health and Performance Analysis Reports (PAR) illustrating your company's financial health, ratios, performance scores, strengths, weaknesses, advice for improvements, and comparisons to other firms and the profit leaders.
Full access to ALL of the 2022-2023 printing and packaging industry financial ratios reports including over 100 ratios for all printers and the profit leaders. Included Included
Select, filter, and report survey data by:
- Geographic Region
- Sales Volume
- Market Segments
- Production Equipment & Services
Included Included
Report of Income Statement Ratios for all printers and the profit leaders including:
- Percentage of Sales and Value Added
- Paper, Substrates, Click Charges, and Outside Services
- Factory and Selling General Administrative Expenses
- Gross and Net Profit (Loss)
Included Included
Report of Balance Sheet Ratios for all printers and the profit leaders including:
- Current and Fixed Assets
- Current and Long Term Liabilities
- Shareholders' Equity
Included Included
Report of Liquidity & Activity Ratios for all printers and the profit leaders including:
- Current Working Capital Ratio
- Quick Acid Test Ratio
- Days Cash For Operating Expenses
- Days Sales Outstanding Collections
- Return on Net Assets (RONA)
Included Included
Report of Employee Ratios for all printers and the profit leaders including:
- Percent of Factory, Admin, & Sales Employees
- Sales per Factory, Admin, & Sales Employee
- Payroll per Factory, Admin, & Sales Employee
Included Included
Online help, live phone support from a consultant, and a Quick-Start guide with easy to understand instructions. Included Included
Runs in the Cloud, so you have access anytime, from anywhere with a PC, MAC, iPad, or tablet and an internet connection. There's no software to install and you automatically receive the latest enhancements. Included Included
All data is held in strict confidentiality and protected with the highest levels of security including cryptographic protocols, data encryption, and complex password strength requirements. Included Included
Includes an online analysis of your company's financial health and Performance Analysis Reports (PAR) specific to your company. Enter your company information, financial statement, and balance sheet into user-friendly online forms and instantly receive comprehensive Performance Analysis Reports showing your company's financial health, ratios, performance scores, strengths, weaknesses, and advice for making improvements. Not Included Included
Provides insight into your organization's performance and ratios including the purpose of each ratio and what it means to your company, your performance score for each ratio, where your company is doing the best, and advice for improving the areas that need attention.
- Labor, material, factor, overhead, and other costs
- Plant productivity and efficiency
- Operations, accounting, and other business practices
- Sales win/loss, sales support costs, and commissions
- Break-even, contribution, and profit margins
- And other advice for improving your company
Not Included Included
Enter income statements, balance sheets, and other financial information for multiple fiscal years and compares costs, profits, practices, and financial performance to prior years. Helps you identify trends in your company's financial performance, predict the direction of future financial performance, and proactively recognize and correct potential financial issues. Not Included Included
Analyzes your Income Statement Ratios and benchmarks to other firms and the profit leaders including:
- Percentage of Sales and Value Added
- Paper and Substrates
- Click Charges
- Outside Services
- Factory Wages & Expenses
- Gross Profit
- Selling General Administrative Wages & Expenses
- Net Profit (Loss) Before Income Taxes
Included Included
Analyzes your Balance Sheet Ratios and benchmarks to other firms and the profit leaders including:
- Current Assets
- Current Cash
- Current Accounts Receivable
- Current Inventory
- Fixed Assets
- Factory Machinery Fixed Assets
Included Included
Analyzes your Liquidity & Activity Ratios and benchmarks to other firms and the profit leaders including:
- Current Working Capital Ratio
- Quick Acid Test Ratio
- Days Cash For Operating Expenses
- Days Sales Outstanding Collections
- Return on Net Assets (RONA)
- Paper and other Substrates Ratios
Included Included
Analyzes your Employee Ratios and benchmarks to other firms and the profit leaders including:
- Percent of Factory, Admin, & Sales Employees
- Sales per Factory, Admin, & Sales Employee
- Payroll per Factory, Admin, & Sales Employee
Included Included
Analyzes your Operations practices and benchmarks to other firms and the profit leaders including:
- Estimates Per Estimating Employee
- Estimate Win / Loss Rate
- Orders Per Order Entry Employee
- Orders Created via a Web Storefront
- Spoilage Costs % of Sales & Value Added
- Training Costs % of Sales & Value Added
Included Included
Analyzes your Purchasing & AP practices and benchmarks to other firms and the profit leaders including:
- Purchasing Practices
- Inventory Management Practices
- Accounts Payables Practices
- Vendor Payments Practices
Included Included
Analyzes your Invoicing & AR practices and benchmarks to other firms and the profit leaders including:
- Job Costing Practices
- Invoicing Practices
- Accounts Receivables Practices
- Customer Payments Practices
Included Included
Benchmarks your company's financials against hundreds of other firms and the profit leaders. Select, filter, or narrow down the list of companies you want to compare against including:
- Geographic region (i.e., Northeast, Northwest, Canada)
- Sales range (i.e., $1-5 million, $5-10 million, $60-80 million)
- Market segments (i.e., commercial, labels, POP, signs, apparel)
- Equipment (i.e., sheetfed, web, wideformat, inkjet, flexo, screen)
- And many other criterias
Not Included Included


Profectus Inc 100% Secure Site Site Lock 100% PCI Compliance 99.9% Uptime


Schedule a demo Schedule a demo